Reading LangGraph Execution Through the Instruction Surface Not the Span Surface
Span monitoring shows the graph ran; only instructions show it worked.
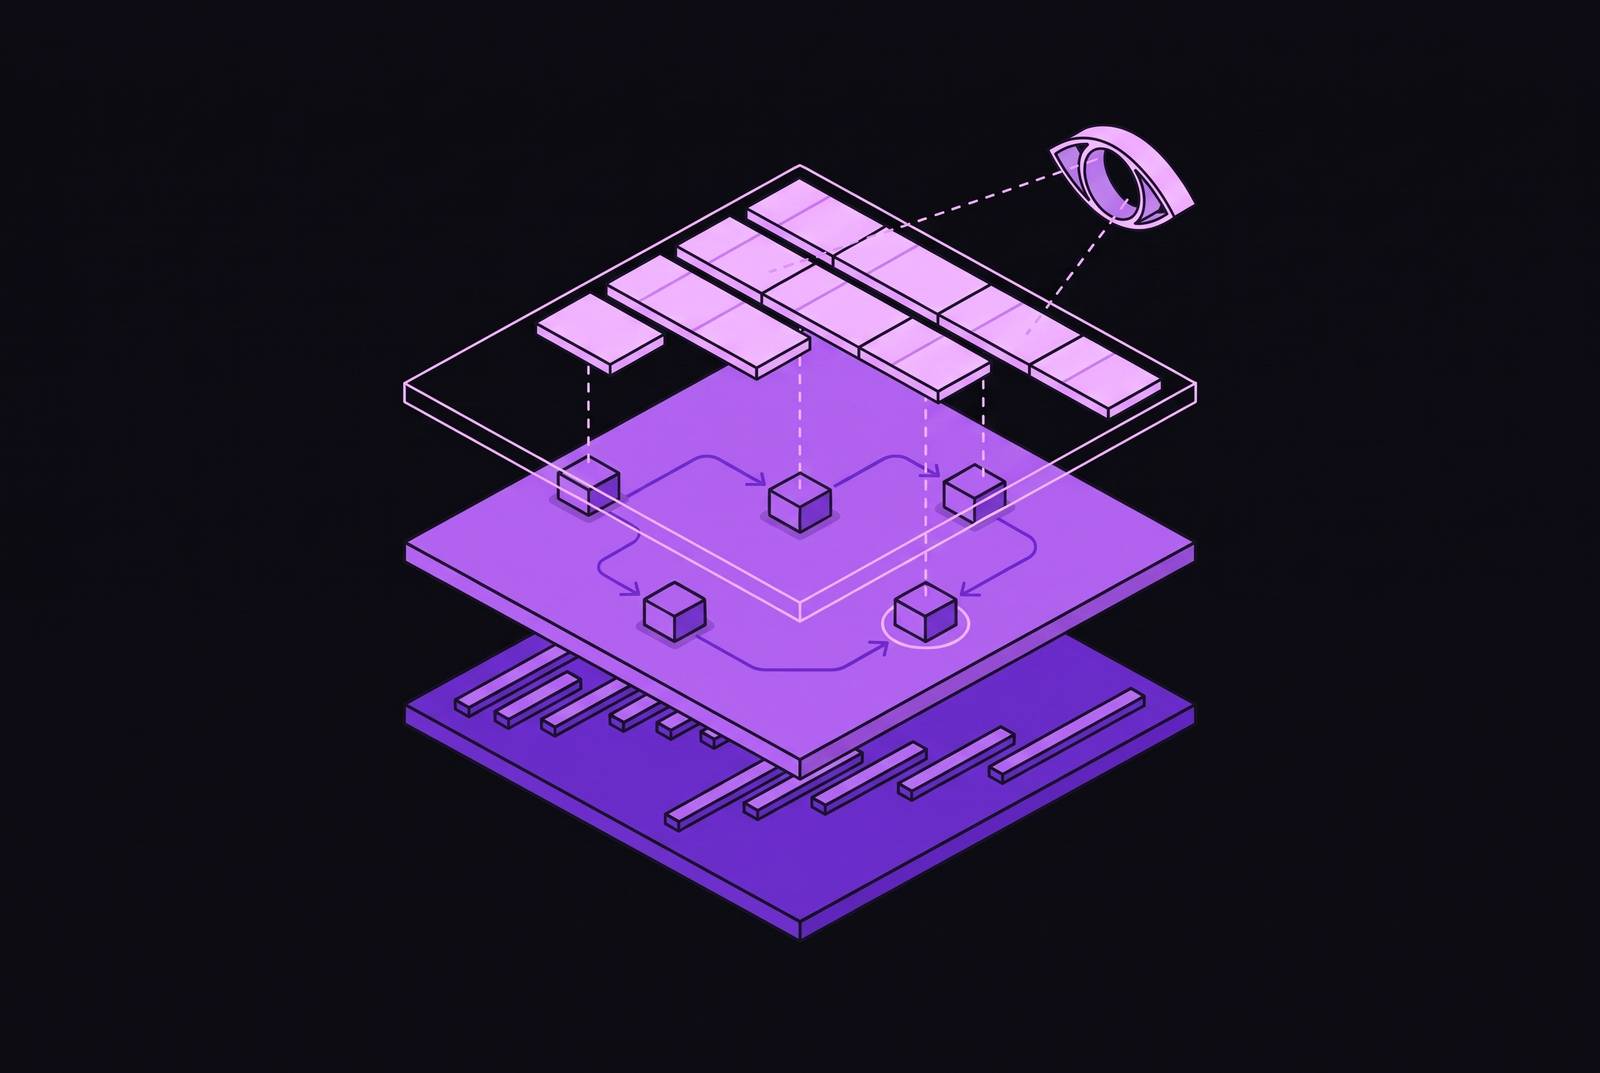
LangGraph makes the distinction concrete through two views of each execution, the span surface and the instruction surface. Span monitoring shows whether the graph ran, while the instruction surface shows whether it followed instructions, used tools correctly, and grounded its answer. Only the latter can expose a successful execution that produced the wrong result.
Why LangGraph's execution surface splits into two distinct readable layers
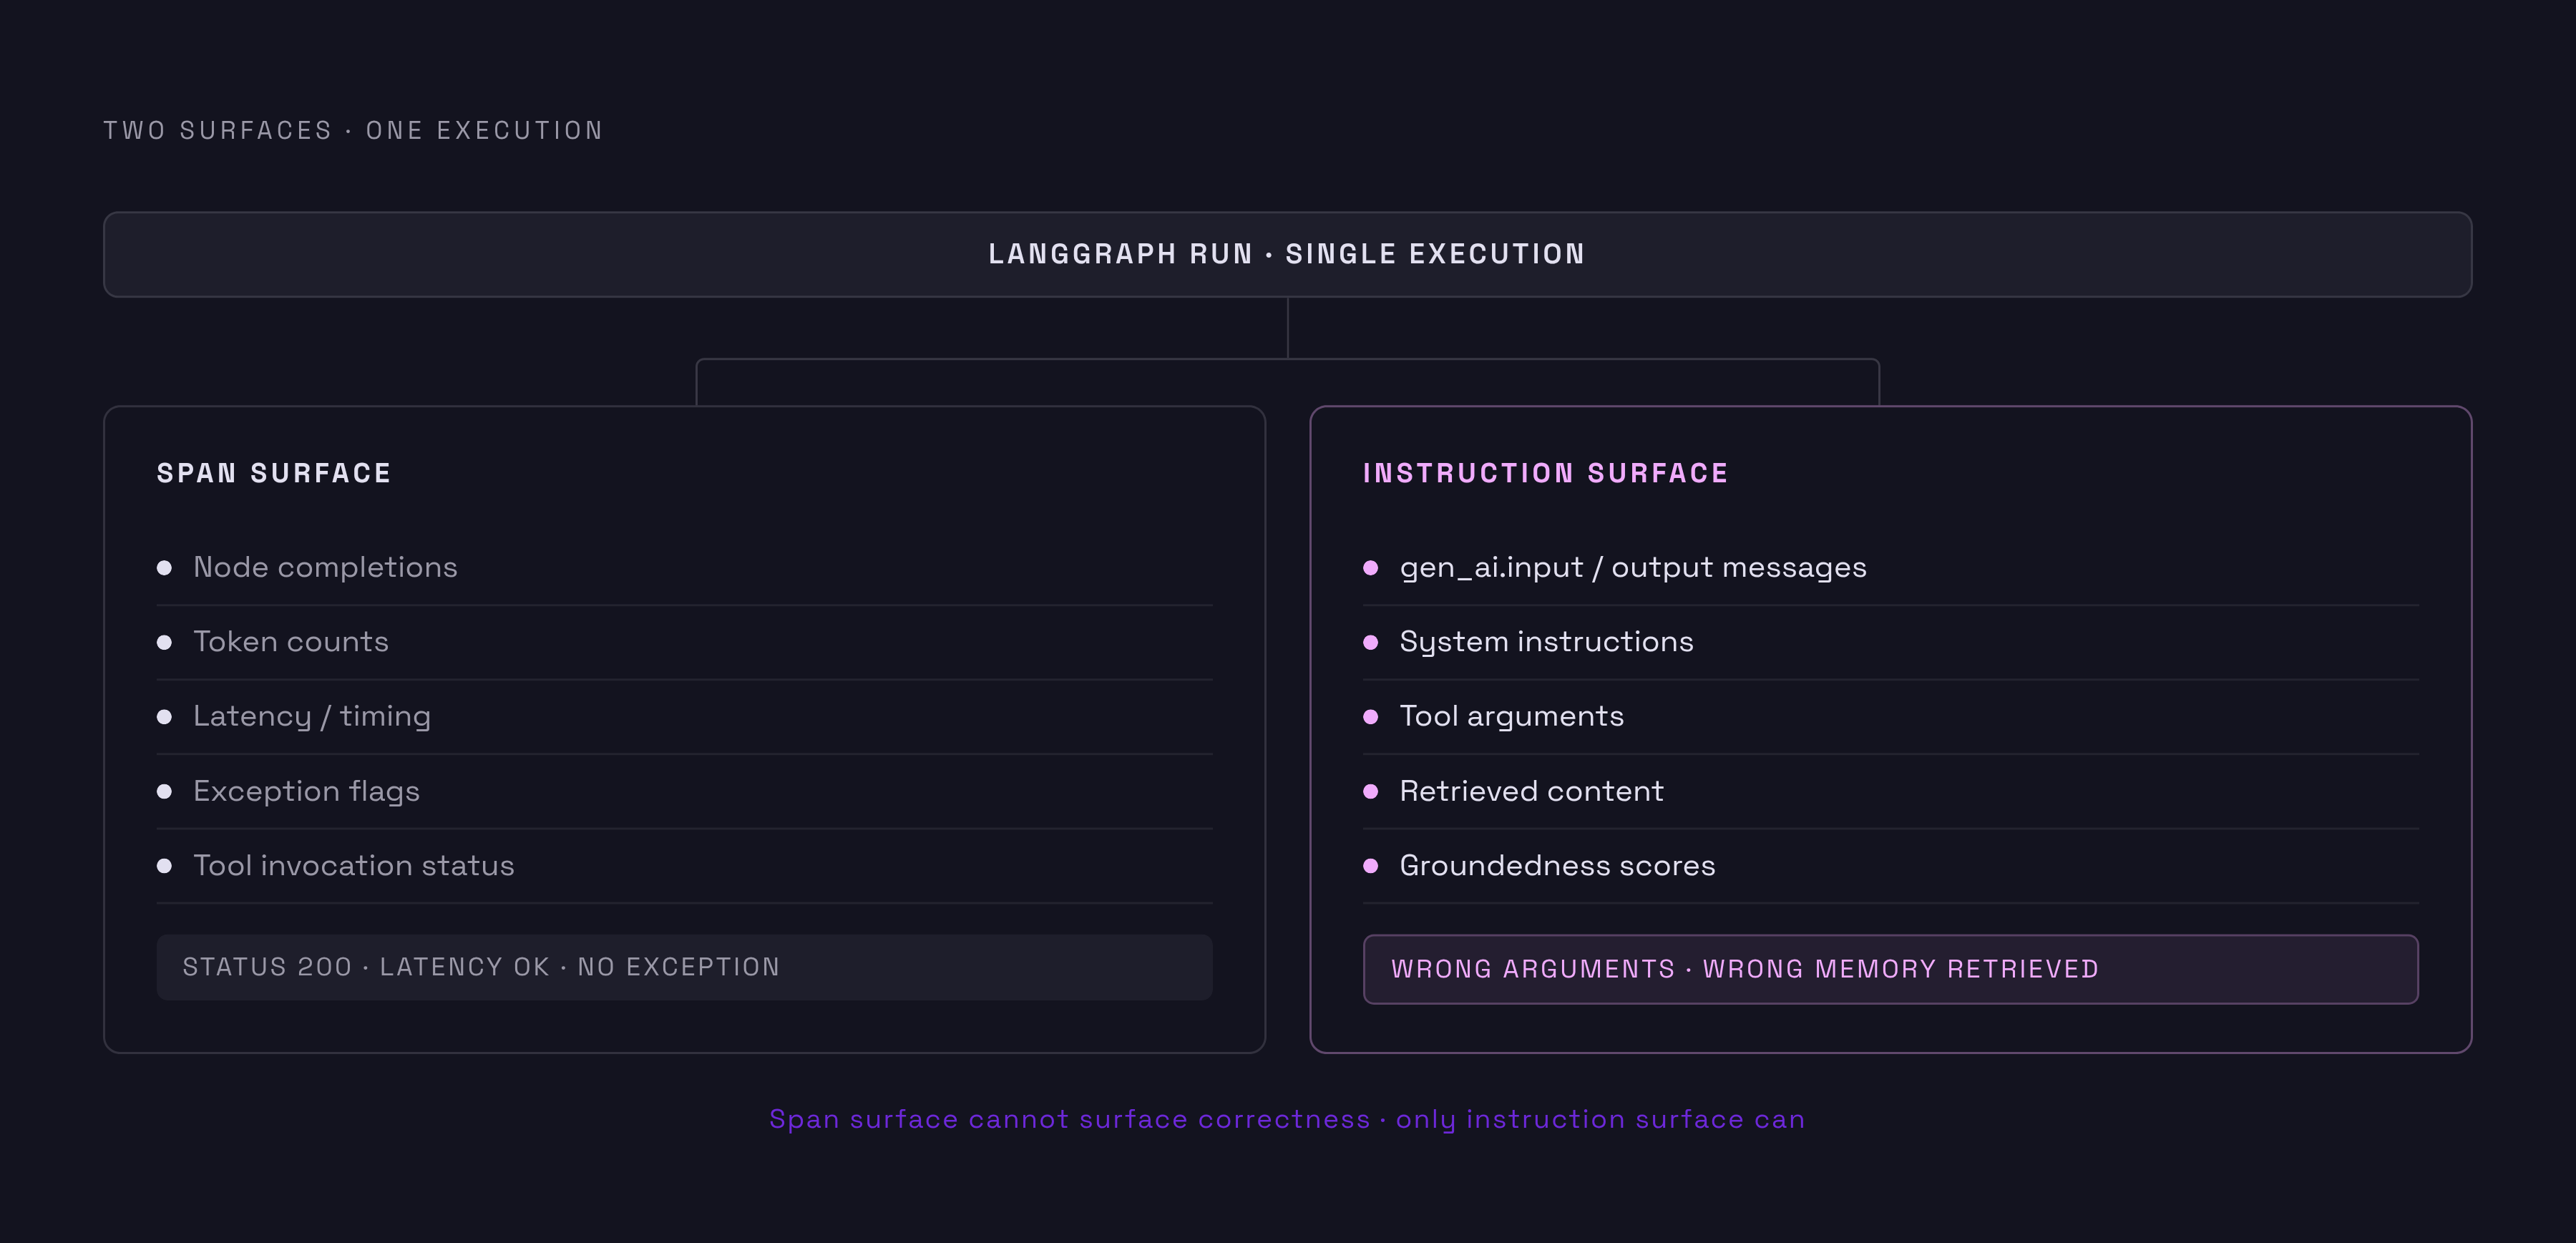
A dashboard can be green while the run beneath it is broken. The request returned status 200, latency stayed within the SLA, and no exception was raised, but the agent gave an answer that did not help the user. These measurements describe different properties of the same execution. The span surface shows whether the run finished, while the instruction surface shows whether it did what the task asked.
Both surfaces exist during the same LangGraph run. Infrastructure sees node completions, token counts, timing, and exception flags, but those signals do not establish that the agent called the right tool or used its response faithfully. To check that, the instructions, arguments, retrieved content, and output must be read together. The distinction is structural.
What does production monitoring for LangGraph record at the span surface, and where does it stop?
The span surface supports infrastructure health, latency budgeting, and retry accounting. Those are necessary functions in a production deployment. OpenTelemetry-aware APM can show where execution slowed, which nodes completed, and whether a tool invocation raised an exception. Its structural view also helps distinguish time spent invoking an agent from time spent executing a tool. None of that becomes less useful because it cannot establish answer quality.
The 2026 OpenTelemetry GenAI semantic conventions define instruments for these operational measurements, though the conventions remain in Development. The metrics gen_ai.client.token.usage, gen_ai.invoke_agent.duration, gen_ai.invoke_agent.tool_calls, and gen_ai.execute_tool.duration are histogram instruments. The conventions also describe create_agent as a CLIENT span and plan as INTERNAL. An invoke_agent span can be CLIENT for a remote service or INTERNAL for an in-process agent, with execute_tool representing individual tool invocations.
This structure reveals topology and timing. A completed tool invocation does not establish that its arguments identified the right entity, and a completed retrieval does not establish that the memory belonged to the right user. Successful node transitions also cannot show that later steps still follow the original plan. The boundary is therefore specific.
How silent failures exploit the gap between the two surfaces
A tool can return an empty array or a broken response without causing the LLM to throw an exception. The model can instead continue with plausible invented content. The graph then completes, and its spans close cleanly. Monitoring that reads only completion signals has no evidence that the task failed.
The logistics postmortem illustrates how this gap widens at an agent handoff. It found that a sub-agent failure looked unrelated in the logs because cross-agent trace propagation was missing. The failure could not be read in its full execution context. That breaks the connection between the initiating instruction and what happened downstream, even when individual invocations remain visible. A shared trace ID is therefore a prerequisite for understanding behavior across that handoff.
An early tool response can become the basis for downstream output without producing an infrastructure error at any subsequent step. Payload visibility is essential to locating that first divergence. Plan drift and wrong-branch selection are harder still, because the evidence lies in the relationship between steps. Reading LLM spans on their own cannot show where the execution stopped following the original instruction.
What the instruction surface actually contains and how the 2026 OTel conventions expose it
The instruction surface consists of inspectable execution content. The 2026 conventions define opt-in fields for gen_ai.input.messages, gen_ai.output.messages, and gen_ai.system_instructions. These fields expose what the model received, what it produced, and the instructions governing that exchange. Their status remains Development, and capturing them is optional. Even so, these fields give instruction-level observation a shared set of names.
The conventions move prompt and completion content from log events for each message to aggregated attributes. Content can be recorded as structured span attributes or on the dedicated span event gen_ai.client.inference.operation.details. The two surfaces therefore differ in what is read and can share a tracing system. A trace populated only with timing and status supports operational inspection. With content fields populated, it can also support comparison between the required behavior and the actual response.
That comparison needs more than the final completion. Tool arguments must be judged against the user's intent, retrieved content against the instructions, and output against the data the tool actually returned. In a multi-step trace under a parent agent.task span, the original instruction is the reference point. Child agent.step spans and nested tool.call spans become units that can be evaluated against it. A mid-chain output may look plausible in isolation while plainly diverging from the parent's task.
Across agents and sessions, that reference point must remain reachable. Trace ID propagation connects agent handoffs, while session-level observability makes multiple invocations within a user interaction readable as a sequence. Without that connection, a retrieval or completion can be evaluated without the instruction that gives it meaning. The logistics case exposes precisely this limitation. Connected traces make it possible to judge retrieved evidence and later decisions in the context of the same user request.
The three instruction-surface checks that catch what span monitoring cannot
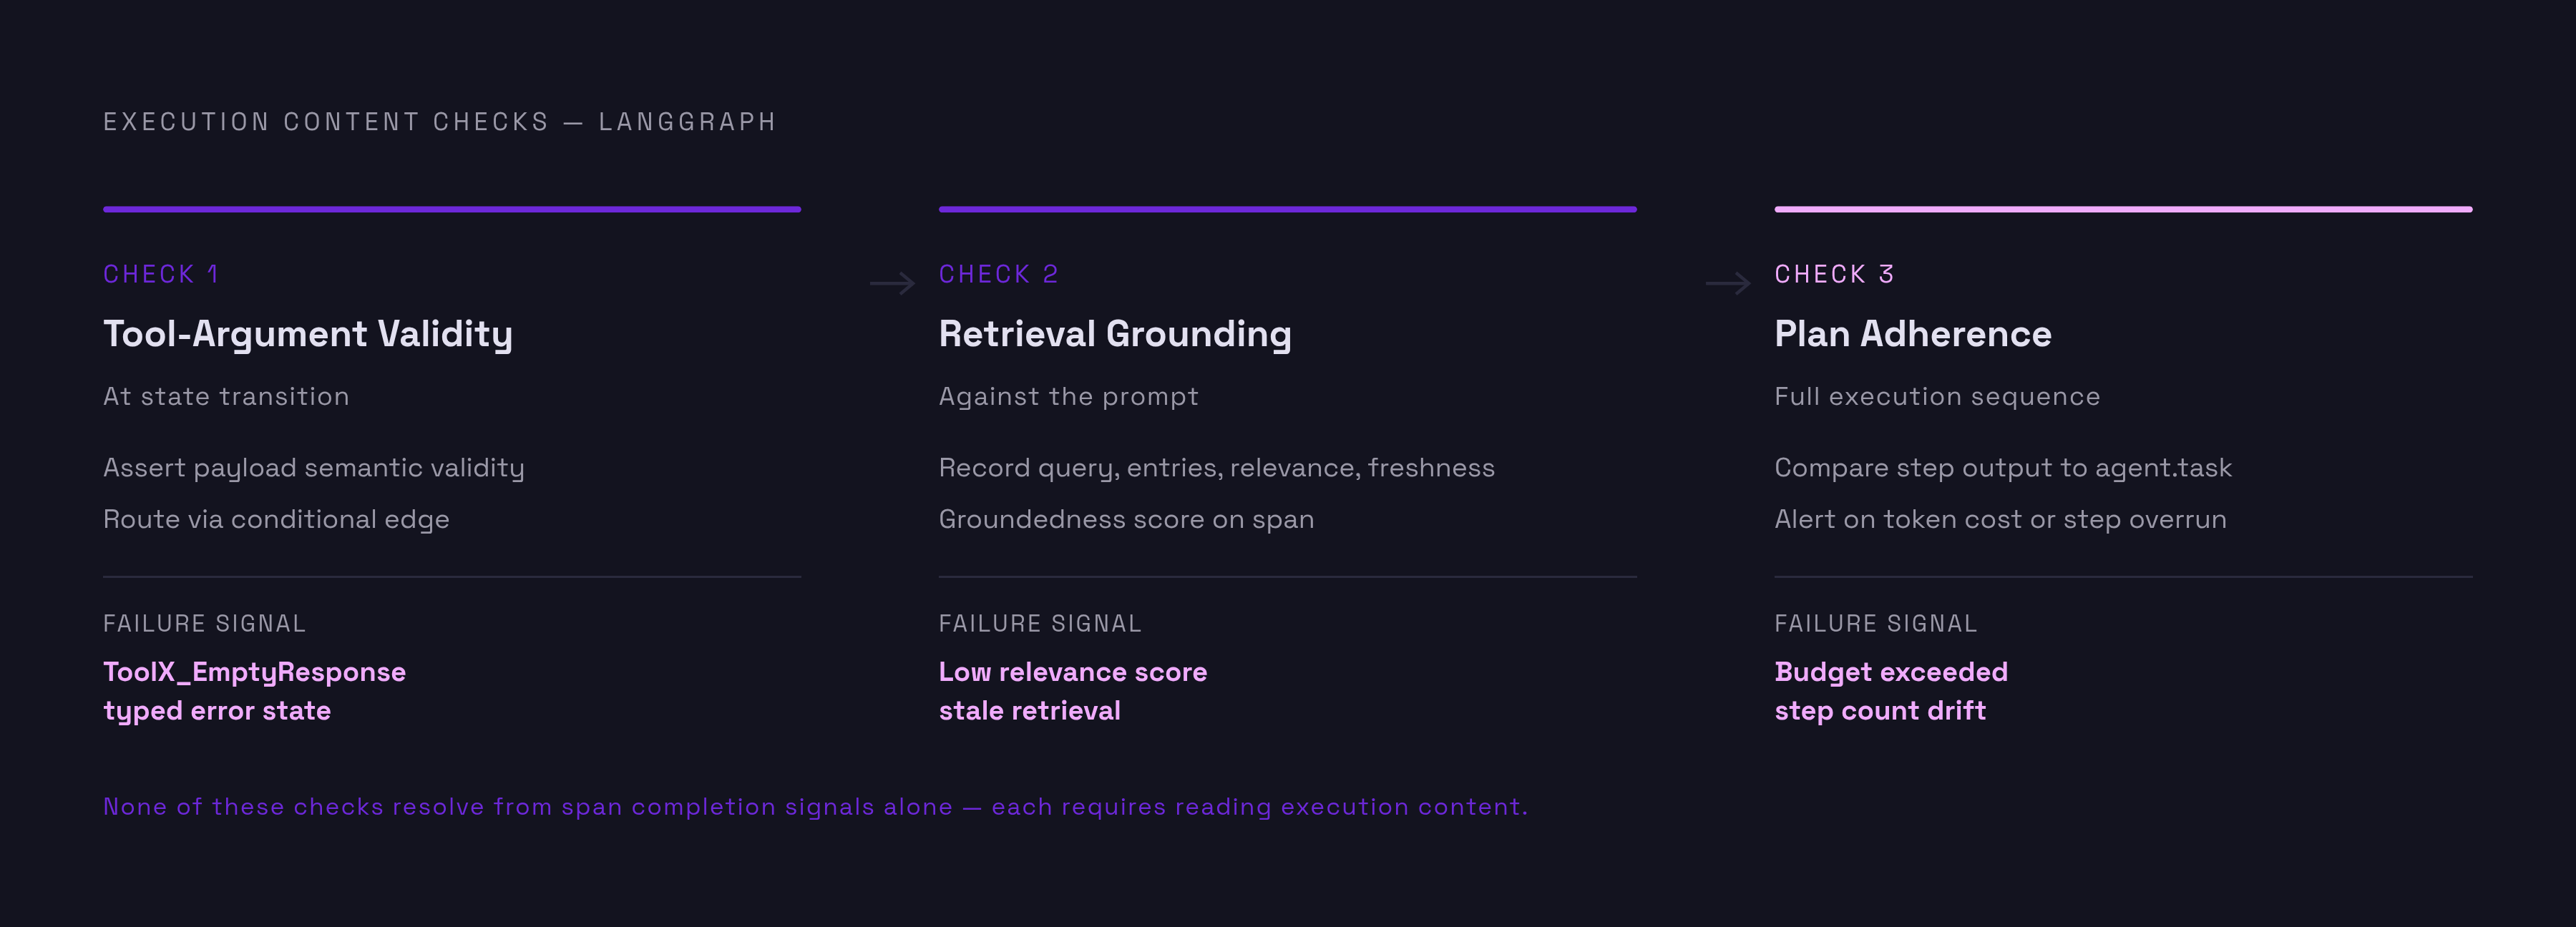
Check 1 is tool-argument validity at the state transition. The question is whether the payload entering the next node is semantically valid. A non-empty response can still be wrong for the intended operation. The check therefore covers the relationship between the requested action, the tool arguments, and the data handed onward. Engineers should assert that validity at the transition and represent invalid results as typed error states that conditional edges can route to a fallback.
For an empty tool result, a graph-state error named ToolX_EmptyResponse makes the failure available to routing logic instead of silently placing bad data in the next LLM prompt. Retry behavior needs the same care. A retry that bypasses LangGraph's native recursion limits and conditional edges can corrupt the checkpoint, turning a recoverable tool failure into state corruption. The repair is not simply to retry more often. Engineers should keep retry handling within those graph controls so that recovery preserves checkpoint integrity.
Check 2 is retrieval grounding against the prompt. A retrieval can complete successfully while returning stale content, the wrong entity, or another user's memory. Aggregate metrics cannot distinguish these outcomes from a useful result. In customer-support and CRM agents, the weakness can lie in stale or ungoverned context rather than the underlying model, as knowledge bases drift from policy and connected systems define the same entity differently. Engineers should record the query, returned entries, relevance scores, and freshness on each retrieval span, then attach a groundedness evaluator whose score remains on that span.
Check 3 is plan adherence across the full execution sequence. Each step's output must be compared with the parent agent.task instruction to detect drift or wrong-branch selection. No isolated completion can supply that comparison by itself. Silent loops also need token-count monitoring and step-count-per-task alerting, because going over a multiple of the expected task token budget can be a sign that the plan has broken, as well as a rise in cost. Engineers should evaluate the connected sequence and route those budget and step-count signals into alerts, preserving the context needed to distinguish the two.
Sampling strategy for the instruction surface — what to keep and why
On high-volume systems, most uneventful executions add little diagnostic value compared with failures and runs near the edge of success. Tail-based sampling addresses that imbalance by deciding what to retain after meaningful execution signals are available. The recommended policy retains spans where a hallucination or groundedness evaluator fires above threshold, where token cost exceeds a per-request budget, or where a user signals a negative outcome. A sample of clean successful runs supplies the baseline for comparison.
This policy depends on reading the instruction surface. Latency alone cannot flag a fast response that broke its instructions, but a semantic evaluator or a negative user outcome can mark it to be kept. Evaluation results attached to the spans they judge can drive both sampling and alerts when scores drop. The retained record then contains the failing check together with its execution context. That makes the trace useful for diagnosis and prepares it for the repair workflow, rather than leaving an engineer to reconcile a detached score with a separate execution history.
Turning instruction-surface failures into fixes through the trace-to-coding-agent loop
The emerging trace-to-coding-agent pattern routes a structured failure brief from the observability stack over MCP, giving a coding agent the evidence needed to propose a change. For an instruction-level failure, that evidence must go beyond a span identifier and an error label. It includes the tool result, the downstream behavior, and the instruction that behavior violated. Those details support a prompt, schema, or routing fix.
The QueryLens open-source project, merged October 2026, shows how the brief-to-coding-agent workflow works for database issues. Each issue card produces a Markdown brief containing what happens, the responsible lines, the SQL, the request's statements, the surrounding code, and the ORM fix. Its MCP tools include list_projects, list_issues, get_issue, list_regressions, and set_issue_status. The example establishes a concrete handoff format. For LangGraph failures, the corresponding evidence comes from the instruction sequence.
Failures that keep happening should be grouped into issues before they are routed. One trace can help explain a single failure, while several traces with the same plan drift can give grounds for changing how routing logic or system instructions work. The distinction affects the repair's scope. An empty result followed by a made-up routing decision, for example, calls for checking the transition and the instruction it broke, even if the execution succeeded, since that success cannot prove that retry handling is enough.
The handoff also introduces a security boundary. A coding agent operating over MCP inherits the engineer's file access and tool rights, so a malicious tool response embedded in a failure brief can become a prompt-injection vector. The brief should therefore be treated as untrusted trace input. Glow Labs' November 2026 MCPhantom research shows a related supply-chain risk. When asked to set up a GitHub MCP, a coding agent selected a package from an archived repository in a large majority of sessions, supplying the name from model memory.
A captured grounding failure can be grouped with similar failures, used to guide a fix, and checked for recurrence. That trace is then a labeled example. It can be promoted into an ongoing eval without hand-writing an assertion. The instruction surface thus supplies both the evidence that exposes a production failure and the test that checks whether its repair holds.