LangGraph Observability Without Rewriting Your Graph
A single callback exposes every node, LLM call, and tool step.
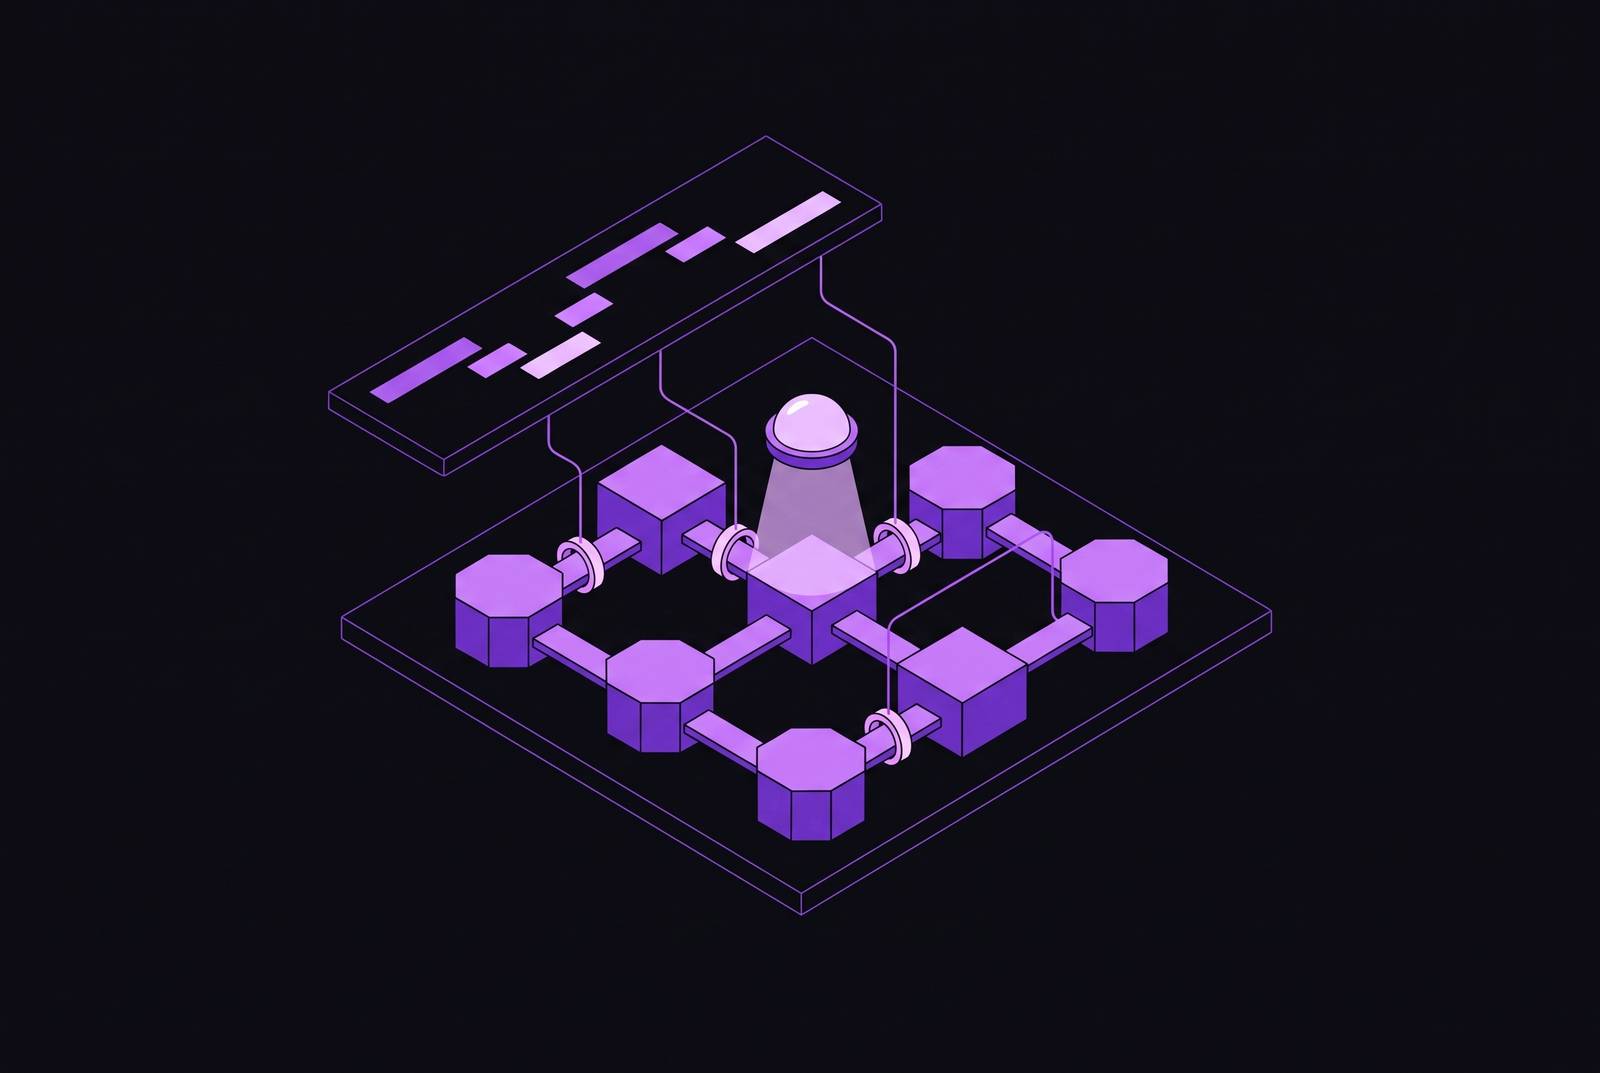
LangGraph observability does not require rewriting node functions. A callback attached to the graph’s invocation config exposes every node, LLM call, and tool invocation, including the state passed between steps. That trace becomes production monitoring when online evaluation checks its results and routes failures into a reproducible repair workflow.
Why standard monitoring misses LangGraph failures
An HTTP request can succeed while the agent answering it is wrong. Traditional distributed tracing records the request boundary and elapsed time, but leaves the decisions inside opaque. It cannot explain why the same tool ran three times or which node sent the graph down the wrong branch. Those are failures of execution and meaning that can occur even when transport succeeds.
Non-determinism makes that blind spot harder to close. The same user message can produce different node sequences on different runs, so there is no fixed execution path to instrument statically. A bad tool result at step 3 can lead to wrong decisions later without causing an HTTP error. To diagnose that failure, the trace needs the intermediate state alongside the final response.
Token spend can also signal a correctness problem. An agent looping through tool calls may first reveal its confusion through anomalous consumption without a visible exception. Request duration and aggregate cost can flag unusual behavior, but neither identifies the decision that caused it. What does a proper LangGraph trace show that boundary-level monitoring leaves hidden?
How LangGraph's callback architecture makes non-invasive tracing possible
LangGraph propagates a callback through every node, LLM call, and tool invocation in a run. The callback attaches through the config argument of graph.invoke(), outside the graph definition. Because the callback follows execution, the tracing layer can capture each node’s input state and output update together with its model and tool calls, even when the path changes between runs.
A callback attached to the model inside a single node produces LLM spans, but excludes the tool node and plain Python nodes. Attaching at the graph boundary instead preserves the relationship between those steps and the calls nested beneath them.
A checkpoint holds saved state, while a trace links the execution steps to their timing and calls. LangChain and LangGraph also separate pipeline logic from telemetry exporters, so changing the observability backend means reconfiguring transport while leaving the graph unchanged.
How to add tracing to a production LangGraph agent in Python
The guest support agent has three nodes, named load_guest, agent, and tools, and uses an InMemorySaver checkpointer. Its five tools are lookup_reservation, search_policies, find_pet_friendly_cottages, quote_change, and move_reservation. These are the agent’s business operations. Tracing surrounds their execution without requiring edits inside the node functions.
The setup begins by installing the SDK with LangGraph, setting LANGWATCH_API_KEY, and calling langwatch.setup(). The run_turn function then receives the decorator @langwatch.trace(name="holiday-park-agent"), which establishes the outer trace boundary. That boundary names the operation being observed. It does not change the graph’s nodes, edges, or decisions.
Inside run_turn, the callback comes from trace.get_langchain_callback(). The invocation passes it through RunnableConfig(callbacks=[trace.get_langchain_callback()]) as the config for graph.invoke(). This is the graph-level instrumentation change. The decorator adds the outer span, and the callback links the work inside the graph beneath it. No tracing statements need to be inserted into load_guest, agent, or tools.
Passing the same thread_id to the checkpointer and trace metadata groups the conversation’s spans together in the UI. The label "langgraph-demo" makes those traces filterable without changing node logic.
The wrapper’s return value also supports later testing. run_turn returns the new messages from the current turn, including tool calls, so downstream tests can inspect what the agent did alongside its final wording. That difference matters when an answer sounds right but the tool sequence is wrong.
The same approach in TypeScript
The setup imports LangWatchCallbackHandler and calls setupObservability({ serviceName: "..." }). The compiled StateGraph then receives .withConfig({ callbacks: [new LangWatchCallbackHandler()] }). This configured graph is a drop-in replacement for the untraced graph, with existing node functions, edges, and checkpointer configuration unchanged. The resulting visibility follows the execution tree, just as it does in Python.
What a full trace surfaces that you would otherwise miss
The holiday-park example starts with a concrete guest request. The message is “hi, we're on reservation RES-4821. can we bring our dog, and arrive a day later?” Its trace opens with holiday-park-agent, followed by the inner LangGraph chain, which accounts for almost all of the outer span’s duration. Beneath that chain, load_guest takes 3 ms.
The first agent chain contains an LLM call and routing, with the model consuming nearly all of that chain’s time. The following tools chain runs lookup_reservation and search_policies, with search_policies appearing twice. Those tools complete quickly. A second agent chain makes another LLM call and routes into a tool chain containing find_pet_friendly_cottages. A third agent chain then makes the final LLM call and routes again.
This sequence immediately narrows a performance investigation. The third LLM call takes 2707 ms, while loading the guest and running the tools take little time. The agent requires three model passes before responding. The total request duration would hide where that time went, leaving no way to tell whether tools were slow or the model did repeated work. Per-span timing instead identifies the final model call as the dominant latency contribution in this run.
The repeated policy search raises a different question. Its presence does not by itself prove a defect, but the trace makes the repetition inspectable. Tool spans include arguments and results, so the investigation can examine what each search was asked and what it returned. That evidence distinguishes a tool invocation count from an explanation of the agent’s behavior.
Each span captures the state entering a node and the update leaving it, making it possible to follow a bad result into later steps. The trace records the decisions, inputs, and outputs that explain why a branch ran as well as showing that it ran. This is the semantic gap that request-level monitoring leaves open.
Using trace data to catch failures before users do
When traces are checked by hand, silent failures are found only if someone picks the right conversation to review. An agent may be up and answering requests while giving wrong results. Monitoring infrastructure and semantic correctness are distinct problems, so uptime checks cannot substitute for evaluating the work represented by the trace.
Continuous online evaluation addresses that distinction directly. LLM-as-judge scoring applies quality criteria to real production traces as they arrive, surfacing failures without waiting for a user complaint. It checks whether the output is correct as well as whether the agent finished a run. The trace supplies the conversation and execution context against which that judgment operates. Evaluation then turns recorded behavior into a signal that a production workflow can act on.
A configurable step budget can terminate a run after a set number of LLM calls, providing a last-resort guard against runaway loops. That enforcement belongs in the agent framework or middleware. LangSmith is an observability tool and does not natively enforce this runtime limit.
The response workflow begins when evaluation flags a trace. A Slack alert brings the failure to attention, and the trace enters an annotation queue. The failing conversation then becomes input to a coding agent, which writes a scenario before proposing a fix. This order preserves the behavior that needs correction.
The lesson for production teams is to turn failing traces into new evals automatically. Each incident can add a case to the golden dataset without anyone having to write assertions by hand. The workflow then accumulates examples of failures that occurred under real traffic, including tool-call patterns that development testing missed. Online evaluation detects the problem, while the growing dataset makes that problem part of future checks. Neither role is served by a dashboard that only confirms the agent is running.
Connecting trace data to the fix: MCP and the coding-agent loop
MCP makes trace context available inside the coding workflow. LangSmith has an MCP server for querying traces, so a coding agent can read a failing execution, follow its node sequence, and check its tool-call arguments. The agent can use that evidence to propose a targeted fix without manual reproduction. Detection and repair can therefore share the same execution record instead of relying on someone to translate it into a separate account.
A failing trace triggers a Slack alert with context, and the coding agent reads the trace over MCP. It then writes a scenario that reproduces the failure before proposing a prompt or logic change. A new eval checks the fix for regression.
MCP tool use also remains visible within LangGraph execution. For LangChain and LangGraph agents, MCP tools appear as generic tool-call spans in the same execution tree as native tools. That keeps their arguments and results within the trace’s account of what the agent did. The repair workflow can inspect MCP calls in the context of the nodes and model decisions surrounding them.
Prompt regressions make the value of this loop especially clear. A prompt change can look acceptable in development yet degrade a specific tool-call pattern in production. The trace exposes the exact sequence that broke, the coding agent receives that context, and the scenario preserves the failure as a test case. The graph-level callback is thus the entry point to more than debugging. It supplies the execution evidence needed to move from a silent failure to a targeted change whose behavior can be checked.