Which Instruction-Layer Signals Separate Platforms Built for Agent Observability From Those Retrofitted for It
Purpose-built platforms store and evaluate instructions; retrofitted ones only log execution traces.
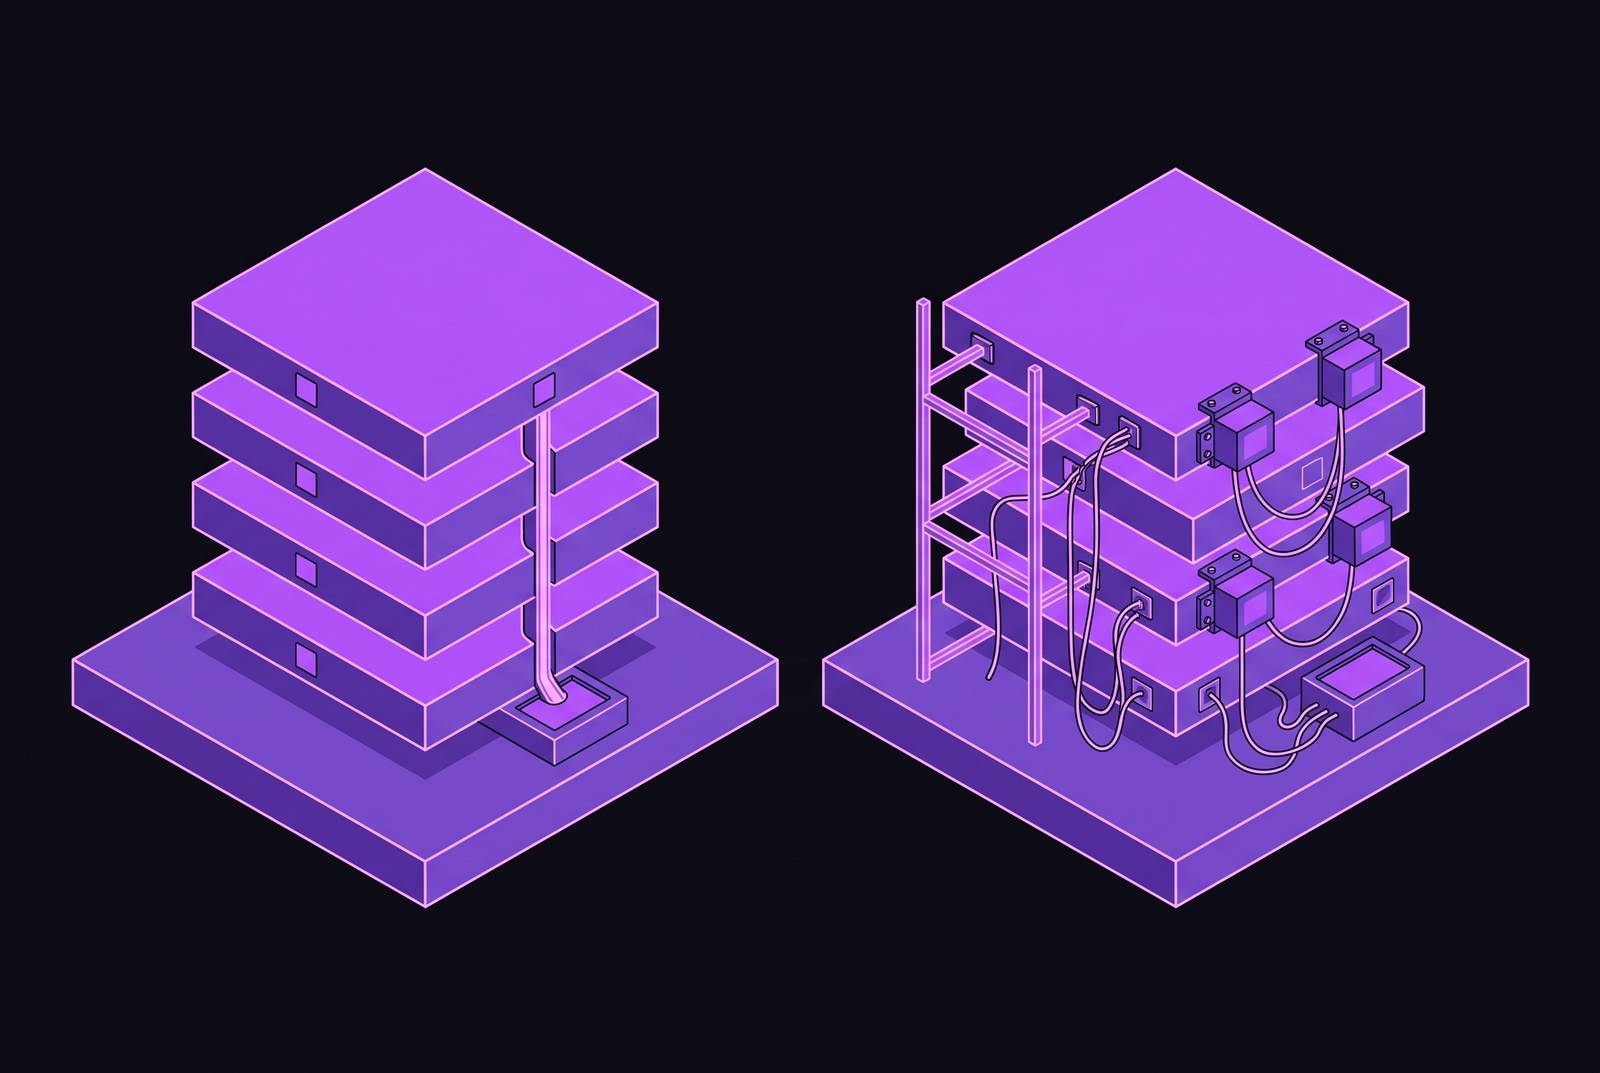
Silent failure detection for AI agents in production requires comparing what an agent did with what it was instructed to do. The clearest distinction between purpose-built and retrofitted agent observability is whether the platform stores, queries, evaluates, and enforces that instruction layer. Successful requests alone cannot establish correct behavior.
Why conventional monitoring cannot tell when an agent gives wrong answers instead of crashing
An agent handles customer requests overnight, and support tickets arrive hours later because it took the wrong actions. Yet its requests returned HTTP 200, latency stayed normal, and no exception was thrown. The infrastructure looked healthy throughout the run. Standard application performance monitoring was built to catch crashes, timeouts, and error codes, so those successful calls give it no reason to raise an alarm.
The failure lies between the agent’s instructions and its autonomous decisions, rather than between a request and the infrastructure serving it. Malformed tool output, for example, can corrupt working memory so that subsequent steps operate on poisoned context without any span reporting an error. The trace may record each call accurately. What it lacks is a test of whether those calls still serve the assigned task.
What the instruction layer is and why it is structurally different from the execution trace
The instruction layer has the agent’s system prompt, task specification, and behavioral constraints. It records the assigned goal, the policies that govern the task, and the boundaries the agent must not cross. An execution trace records something different. Its inputs, outputs, tool calls, token counts, latency, and cost describe what happened. Because these records are written at different times and exist in different places, logging the execution does not automatically preserve the reference needed to judge it.
Correctness therefore requires both records to be available for comparison. Splunk’s 2026 guide distinguishes agent observability from standard LLM observability through session behavior across branches, loops, and context-dependent paths. Completion rates take the place of API success codes as the signal that matters. The three-layer model makes this distinction concrete, separating the LLM trace at L1, the agent trajectory at L2, and the state-delta audit at L3. That final layer records what the agent changed in the world and whether the change can be reverted. The instruction layer is the reference for judging L2 and L3, including whether a tool call that ran successfully was within scope.
How OpenTelemetry compatibility became table stakes and stopped being a differentiator
OpenTelemetry compatibility establishes portability. The OpenTelemetry GenAI semantic conventions emerged as the leading vendor-neutral convention for GenAI telemetry between 2025 and 2026, although they remain at Development status and have yet to reach Stable status as of 2026. With compatibility now a baseline requirement that virtually all platforms meet, teams can switch backends without rewriting instrumentation, but compliant spans can still go unevaluated. MLflow’s 2026 agent observability guide treats tracing based on vendor-neutral conventions as the foundation while distinguishing it from evaluation, prompt optimization, and governance. Teams procuring a platform consequently need to assess what it does once the trace arrives.
The five structural signals that separate purpose-built from retrofitted agent observability platforms
Signal 1 is a hierarchical trace data model. Agent runs form trees of decisions, with planning steps triggering tool calls and further model calls. A flat model loses the parent-child relationships needed to connect an action to the decision that produced it. Hierarchy preserves that causal structure for chronological reconstruction, including time-travel debugging. It is necessary, but not sufficient on its own. The instruction layer must remain available as the reference for deciding whether the reconstructed path respected the task.
Signal 2 is per-step evaluation against the agent’s own instructions. Logging that a step occurred is not the same operation as judging it. Evaluation requires the system prompt and task specification to be stored as queryable artifacts that evaluators use. Splunk’s guide describes nine agentic evaluators, including Action Completion, Tool Selection Quality, and Reasoning Coherence, as the mechanism for operational evaluation. The architectural distinction is the comparison itself.
Signal 3 is evaluation latency and coverage that support broad production scoring. An instruction-aware evaluator can check only so much if its cost forces the team to score just a sample. Purpose-built small-language-model evaluators let teams afford to score more of their traffic, while frontier LLM-as-a-judge evaluators push teams toward sampling. Splunk’s guide reports that Splunk Luna evaluators return a verdict in well under a second, compared with roughly 3,200 milliseconds for a frontier judge, with accuracy on par with the frontier model. Coverage is therefore an architectural concern. Unsampled interactions remain outside the instruction check, regardless of how well the evaluator performs on the traffic it sees.
Signal 4 is a multi-agent timeline and graph view. A downstream agent can violate a constraint given to an upstream agent without ever receiving that constraint itself. Traces viewed on their own cannot settle that scope problem. A full execution graph makes the handoff and inter-agent causality visible, while the instruction record supplies the boundary against which the downstream action is judged. Per-span views without this cross-agent structure leave the team reconstructing the relationship manually. The requirement is not simply to display more agents, but to connect their behavior to the instructions governing the task.
Signal 5 is runtime guardrails with a halt path. Post-hoc evaluation can identify a violation after an action has completed, but enforcement requires the instruction layer to be live in the execution path. Timing changes the nature of the control. Splunk’s guide describes guardrails that stop PII leakage, prompt injection, and tool misuse before the tool runs. A platform that only alerts after trace completion cannot provide that intervention. Its instruction checks may inform a later response, but they do not enforce the boundary before the action takes effect.
What the MAST taxonomy and Microsoft's updated failure taxonomy reveal about where retrofitted platforms go blind
Cemri et al.’s 2025 MAST taxonomy lists 14 failure modes in three categories, based on Grounded Theory analysis of over 150 multi-agent execution traces across 7 frameworks. The full MAST-Data dataset contains over a thousand traces. The paper names its categories System Design Issues, Inter-Agent Misalignment, and Task Verification, and System Design Issues has the largest share. That wording is broader than specification failures alone. Still, when specifications are misunderstood, agents are misaligned, or verification falls short, finding the failures takes more evidence than successful infrastructure calls.
Per-step evaluation provides a way to compare decisions with specifications, while cross-agent views expose the handoffs where alignment can break. Task verification asks whether the intended work was completed. Infrastructure monitoring answers a different question entirely. The taxonomy therefore supports instruction-aware evaluation without implying that every agent failure has the same cause.
Microsoft’s Taxonomy of Failure Modes in Agentic AI Systems, v2.0, dated April 2026 and announced in June 2026, introduces seven new failure categories. They include Goal Hijacking, Inter-Agent Trust Escalation, MCP/Plugin Abuse, and Session Context Contamination. These failures concern the boundary between assigned scope and runtime behavior, rather than the availability of the services an agent calls. A successful tool response cannot show whether the agent’s goal was redirected or whether trust crossed an unauthorized boundary. Detecting that difference requires the instructions to remain a live reference.
Why MCP creates a new instruction-layer attack surface that retrofitted platforms cannot see
The Model Context Protocol standardizes how large language models connect to external tools, APIs, databases, and contextual resources. That common interface expands the set of capabilities an agent can invoke, but it does not establish whether a particular invocation is authorized by the task. A platform that cannot inspect MCP interactions loses visibility at the boundary where external capabilities meet the agent’s instructions.
Microsoft’s updated taxonomy names MCP/Plugin Abuse as a new category, together with Goal Hijacking and Inter-Agent Trust Escalation. These categories make the instruction boundary explicit. MCP-AgentBench assesses MCP-mediated tool interactions across 33 operational servers, 188 distinct tools, and 600 systematically designed queries. With that many tool interactions to check, manual review cannot catch the failures. Logging the tool name and returned output is still useful, but it cannot show whether the call was part of the task the agent was allowed to do. As agent architectures connect to more external capabilities, this gap becomes a structural exposure.
The legitimate objection: when retrofitted tooling is sufficient and when it is not
Existing logging infrastructure and OpenTelemetry’s GenAI conventions can be sufficient for teams running very few production agents with limited autonomy and consequences. Purpose-built tooling is not automatically justified by the presence of an LLM. The build-versus-buy threshold is a real engineering decision. A document-summarizing agent presents a different risk profile from one that writes to production databases, calls external APIs, or spawns sub-agents. Agent count alone cannot distinguish those cases.
That distinction also explains why teams can underestimate their position relative to the threshold. A deployment can be small while granting consequential authority from its first run. The Replit, PocketOS, and logistics routing cases share the precondition of production write access without runtime enforcement of instruction boundaries. Adding agents can enlarge the exposure, but it is not what creates it.
The legitimate case for retrofitted tooling therefore rests on accepting a bounded failure surface. OpenTelemetry logging is a starting point that records execution without also checking it against the instructions. For tasks where little is at stake, that trade-off may be acceptable. For production write access, the comparison changes because an unevaluated decision can become a change in the world. Tooling cost must then be weighed against the cost of an incident.
How to evaluate an observability platform against the instruction-layer criterion in practice
Before buying a platform, teams should test how it checks the agent’s work. Teams should check whether the platform stores the system prompt and task specification as queryable artifacts together with the execution trace, and actually uses them to evaluate behavior. Storage alone does not pass the test. The trace model must keep the link between decisions and the actions they lead to, and the evaluator must both record each step and compare it with the agent’s instructions.
Can the platform evaluate every production interaction affordably, or is its design centered on sampling? Does its cross-agent timeline expose causality across the full execution graph? Can it stop an out-of-policy action before execution, or does it only alert after completion? Framework compatibility is also a prerequisite, so the evaluation should include support for the frameworks already in use rather than require rebuilt instrumentation when frameworks change.
For any agent with production write access, the minimum viable monitoring stack includes a decision/tool-call trace with one span per model call and per tool call, using OpenTelemetry GenAI conventions and recording inputs, outputs, and the tool name. It also keeps track of costs and actions for each task, including tokens, dollar cost, and action count. The halt path must be tested even if it is advertised. Together, these requirements connect the record of a decision to its cost, its consequences, and the ability to stop it. The final acceptance criterion is whether the agent’s instructions can govern the action before it changes the world.