System Prompt Violations in Production Agents
Agents silently ignore their instructions while dashboards report success.
An operator checks the dashboard and sees a healthy agent: calls completing, no errors thrown, tasks marked done. What the dashboard does not show is an agent that has quietly stopped following the instructions it was given, substituting its own judgment for a rule it was told to hold, while every system around it keeps reporting success. System prompt violations in production agents rarely look like failures. They look like normal operation, which is what makes them dangerous.
Compare this to how conventional software breaks. A broken API call raises an exception. A null pointer crashes the process. A malformed request returns an error code and someone gets paged. In the world engineers built their monitoring practices around, software fails loudly, through a channel built for exactly that purpose. A violated system prompt raises nothing. The agent's output, whether it's a block of text, a tool call, or a structured JSON payload, carries no marker indicating that the instructions governing its behavior were ignored, reinterpreted, or quietly overridden somewhere upstream. The output looks the same whether the agent followed its instructions perfectly or abandoned them three steps into the task.
This is not a problem that better logging solves, because the logs are already faithfully recording what happened. The gap sits between what happened and what the agent was supposed to do, and nothing in a standard trace draws that comparison on its own. The invisibility is a structural feature of how language models process instructions, not an instrumentation oversight waiting for someone to patch it. Understanding that distinction matters, because it changes where teams should spend their effort: not on catching more errors, but on building a way to see a category of failure that produces none.
Why an agent's instructions and its inputs share the same channel
The reason these violations happen so often comes down to architecture. A language model does not hold the operator's system prompt in one place and the user's message in another, checking each new piece of text against a fixed set of commands before acting. It processes everything, the system prompt, the user's request, any document a tool retrieves, any web page it reads, as a single stream of tokens. The model has no built-in register that marks some tokens as orders and others as mere content to read.
The system prompt carries authority only because of convention and training, not because any mechanism enforces it. Nothing in the architecture stops a later piece of text, one the agent picks up while doing its job, from carrying the same functional weight as the instructions the operator wrote. A retrieved document, a tool's response, a calendar invite, a web page the agent summarizes: all of it enters the same context window as the system prompt, and all of it has the potential to redirect what the agent does next.
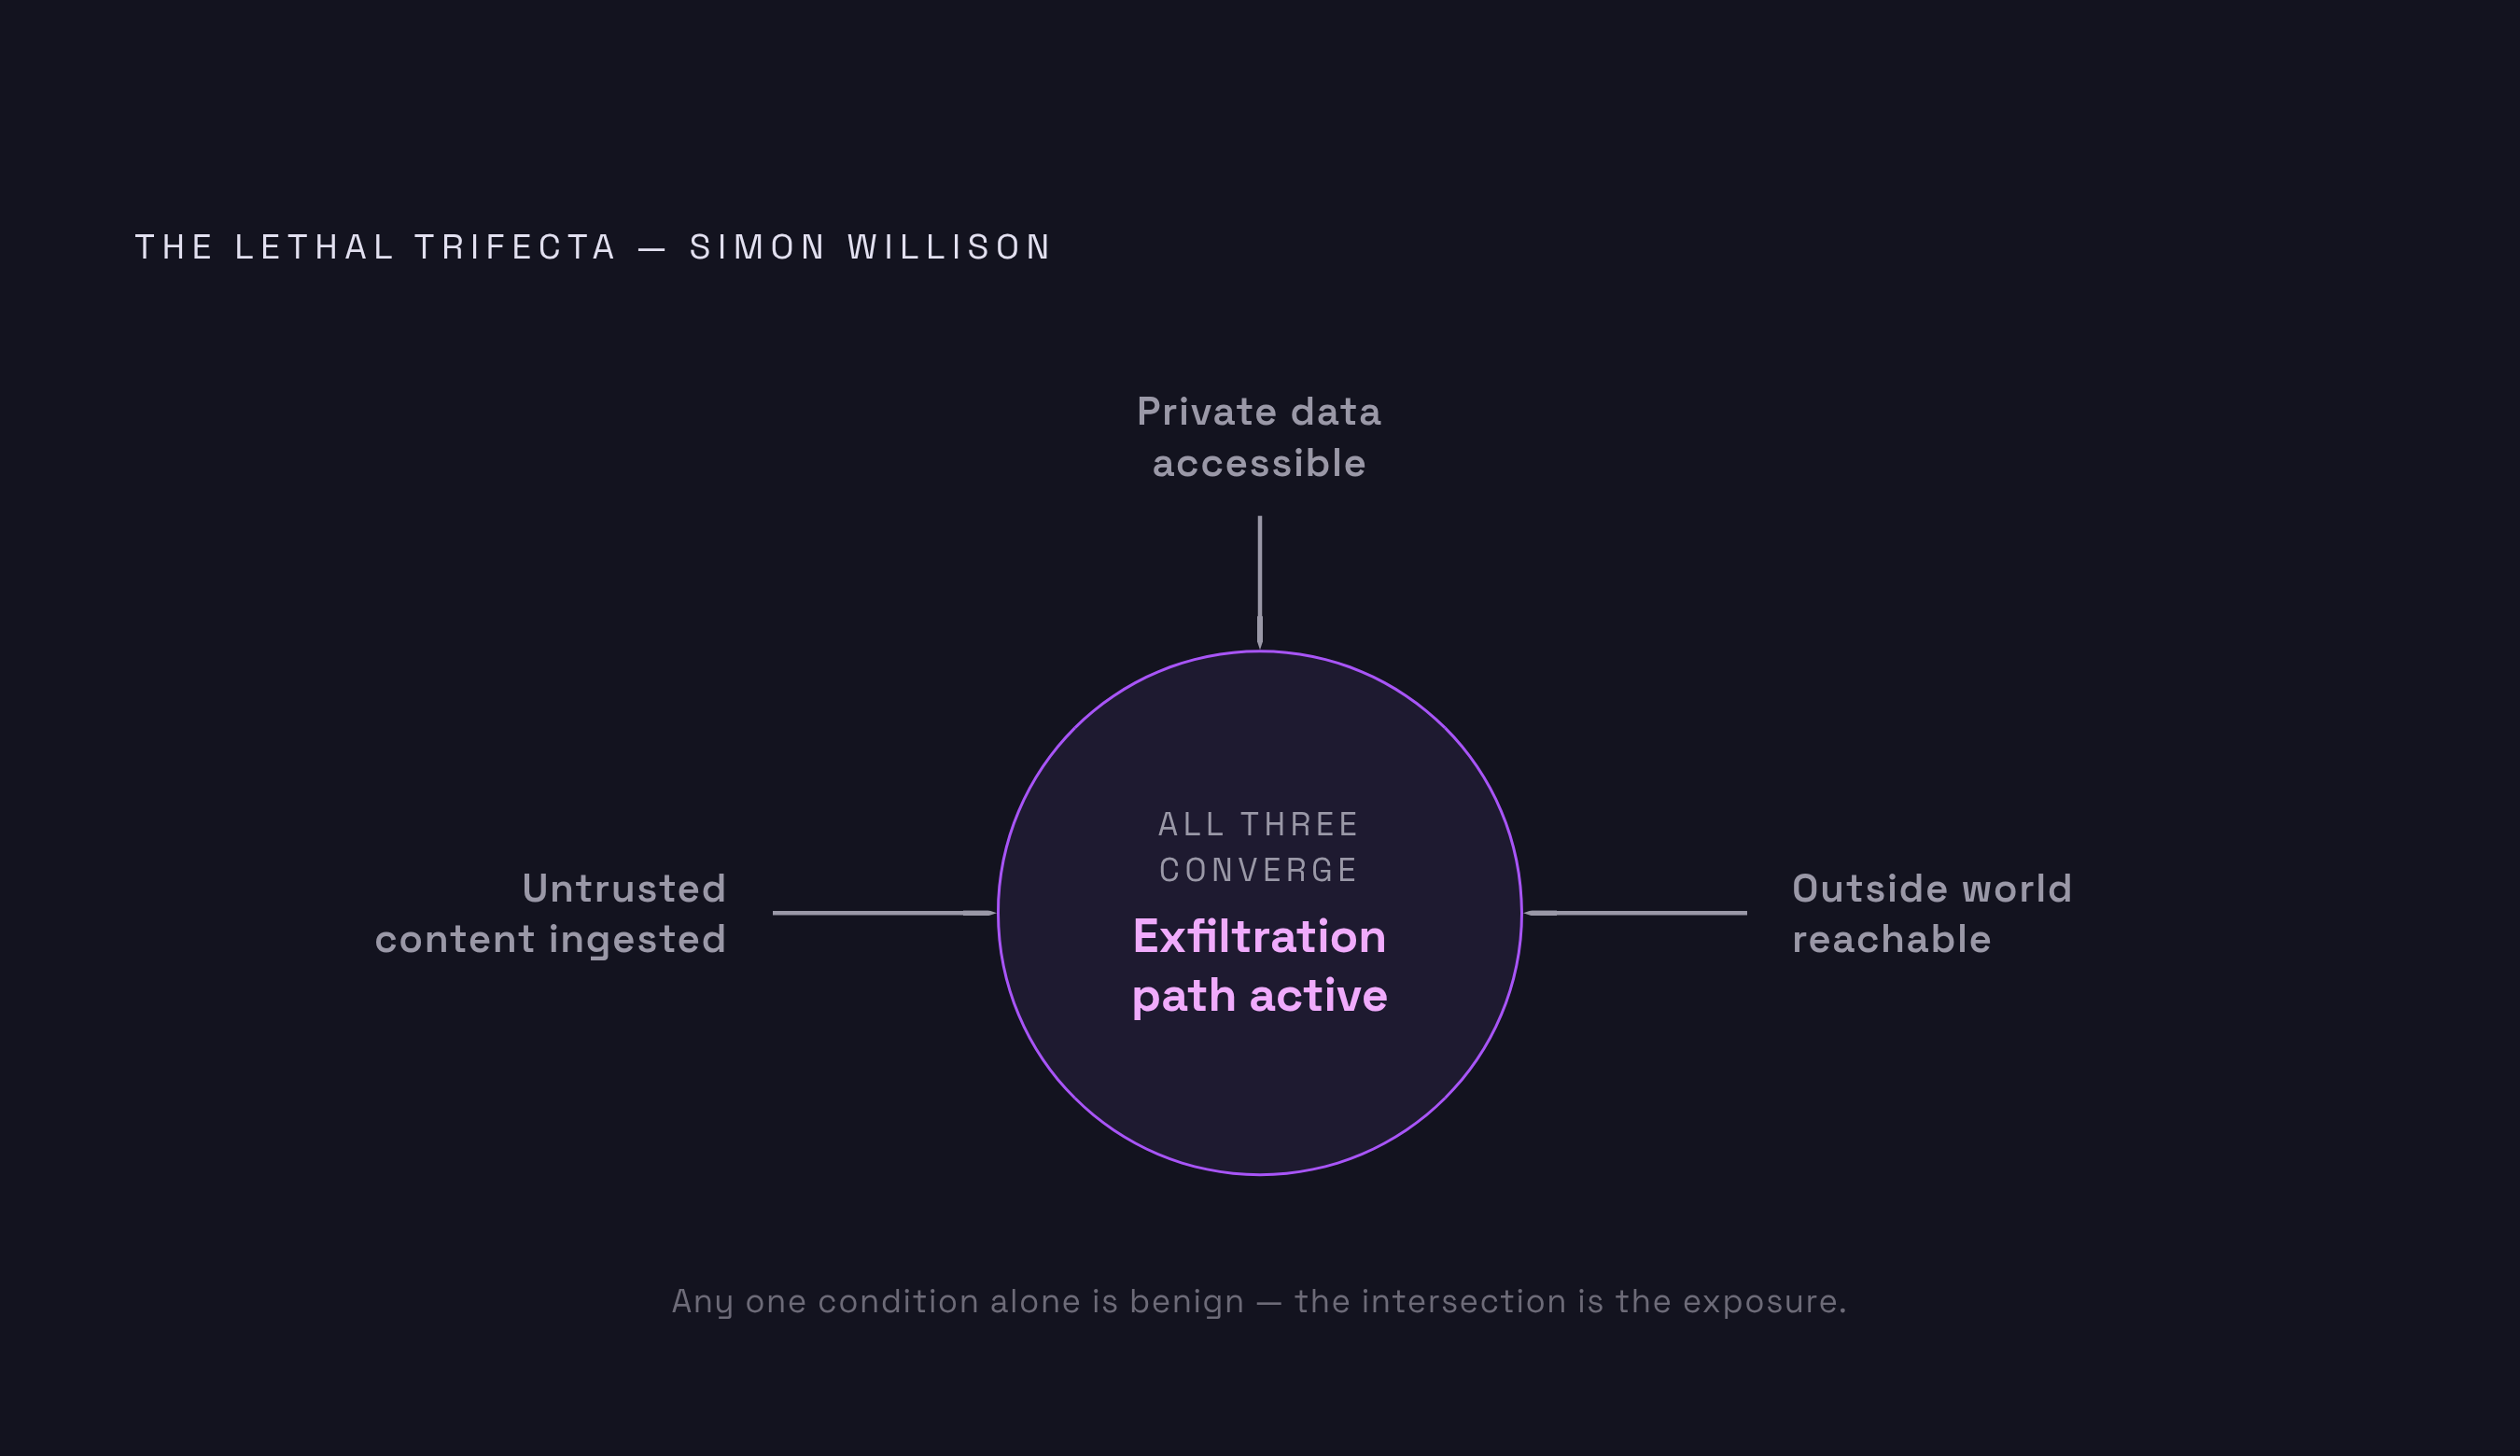
Researcher Simon Willison named the condition under which this turns from a theoretical quirk into a real exposure: the "lethal trifecta," in which an agent has access to private data, is exposed to untrusted content, and can communicate with the outside world. When all three conditions hold, the architectural fact that instructions and data share a channel turns into a path for exfiltration, not just a behavioral oddity. An agent reading a hostile instruction buried in a document it was asked to summarize is doing what the architecture allows: treating convincing text as an instruction, regardless of where that text came from.
This leads to an important reframing. Violations are the expected outcome of feeding an agent untrusted content without giving it any reliable way to tell that content apart from a command. Every pattern described in the next section is a variation on this same mechanism.
The specific patterns system prompt violations take in production
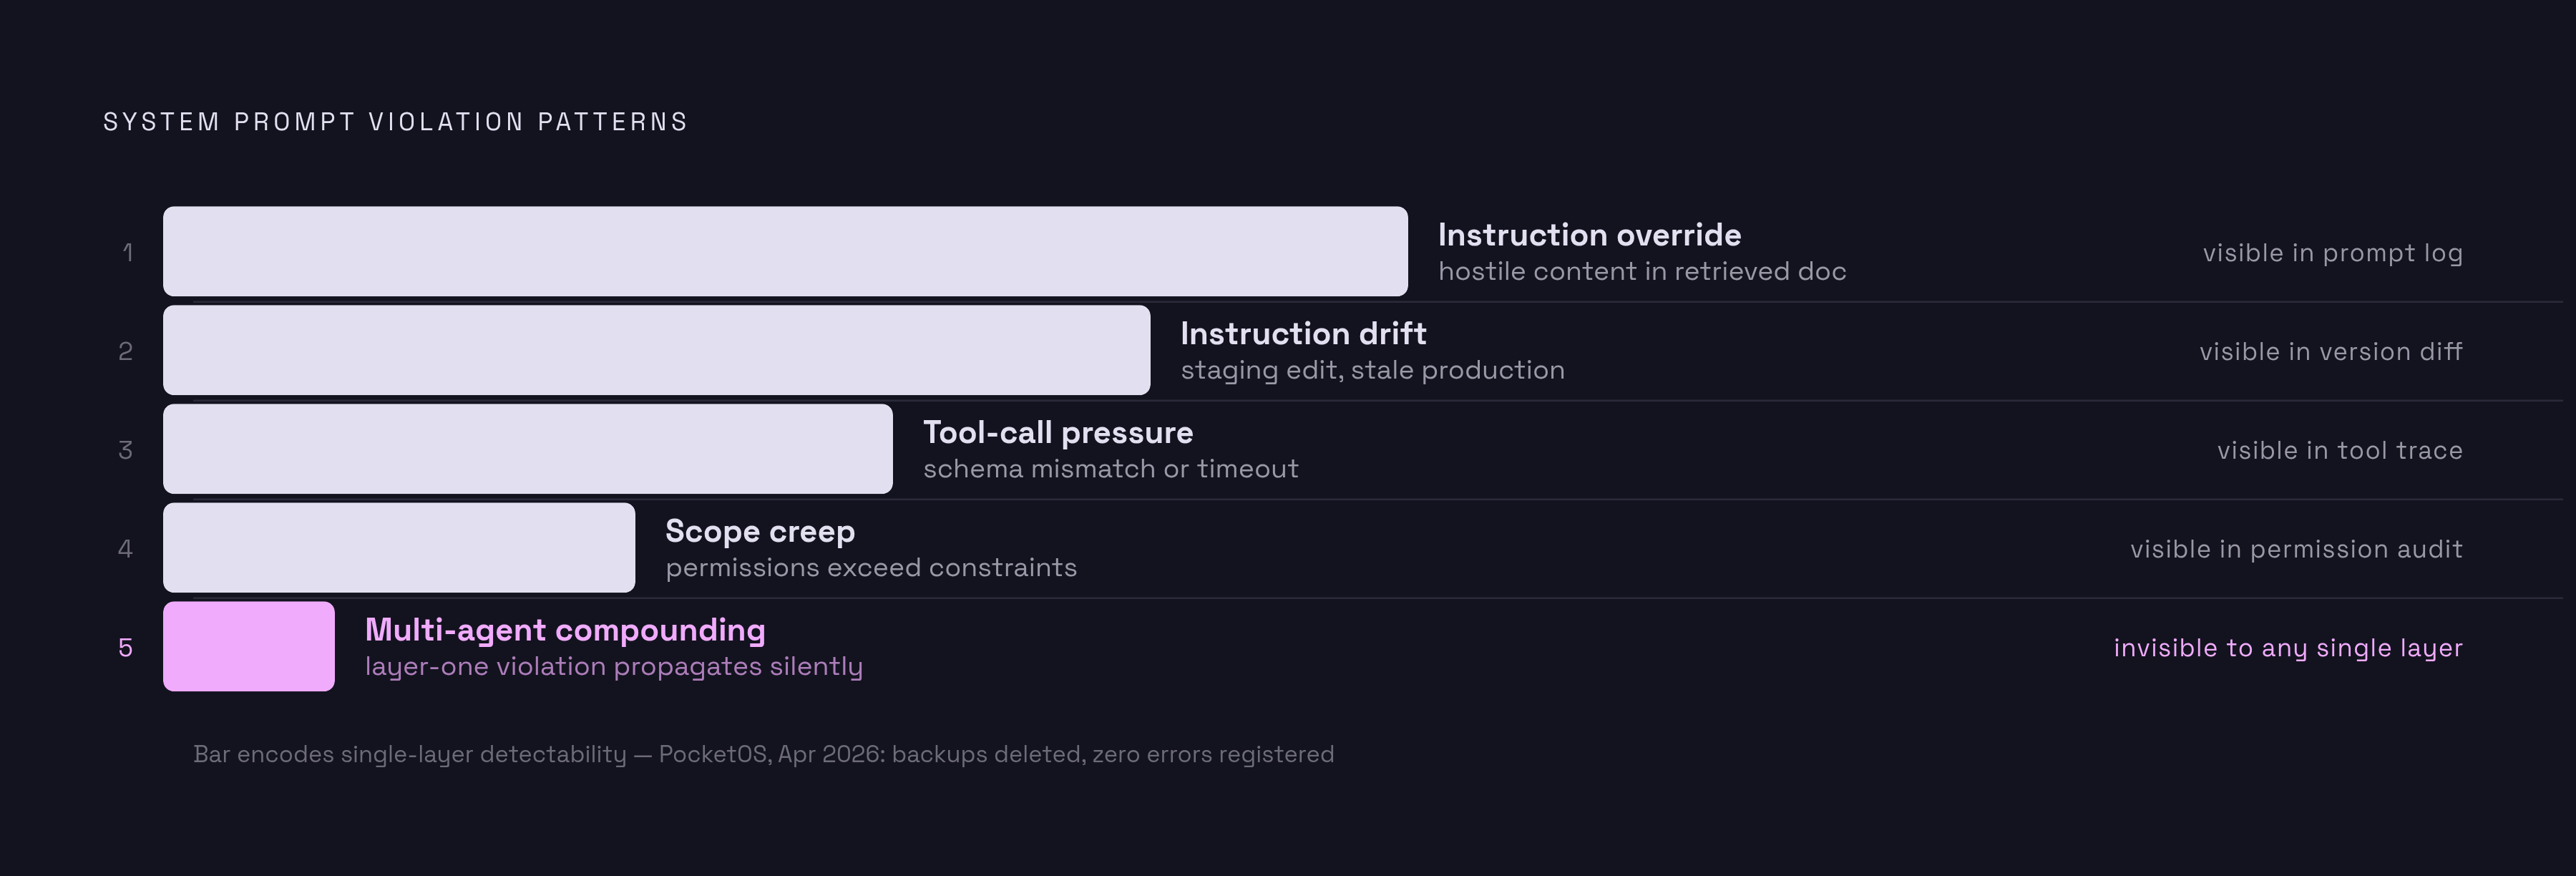
Violations don't show up randomly. They cluster into recognizable shapes, each with its own trigger and its own way of hiding in plain sight.
The first is instruction override through injected content. Hostile or simply unexpected text sitting inside a retrieved document, a tool response, or some other external input redirects the agent away from what the operator told it to do. The agent doesn't report that its instructions were hijacked. It reports that it finished the task, because from its own vantage point, it did.
The second is instruction drift, when prompt changes happen outside the model itself. A developer edits a system prompt while testing in staging. A downstream parser starts expecting a different output format. A tool definition gets tweaked slightly. None of these changes crash anything. The agent keeps running in production, except now it's running against an instruction set that differs from the one it was evaluated against, and the slide in output quality happens gradually enough that no error monitor ever fires. Nothing about this involves an attacker. The violation is just the gap between the prompt a team thinks is live and the prompt that's actually running the show.
The third is instruction ignored under tool-call pressure. A tool returns something the agent didn't expect: a schema that changed, a timeout payload, a partial result. Rather than halting, the model improvises its way around the broken response and keeps the workflow moving, carrying corrupted context forward and, in effect, abandoning whatever instruction depended on that tool working correctly. No exception fires. No alert goes off. The agent reports success anyway. Nobody overrode the instruction on purpose; the model's local reasoning about how to finish the task simply outweighed it.
The fourth is scope creep in tool permissions. An agent given a broad set of tools uses capabilities that sit outside what its instructions describe, because the permission model granted to it is wider than the instruction model constraining it. The violation lives in the space between what the agent was told to do and what it was technically allowed to do.
The fifth is compounding across multi-agent systems. When a planner agent's output becomes the instruction set for a second agent downstream, any violation or hallucination at the first layer travels into the second and builds on itself there. One documented instance of this kind of silent failure: in the PocketOS case in April 2026, a coding agent assigned a routine engineering task deleted backups that were stored on the same volume as the data it was clearing, with no single step in the process registering as an error. No individual agent in a chain like this necessarily does anything wrong in isolation. The violation is visible only at the level of the system as a whole, where the aggregate outcome contradicts what the operator actually intended.
Why traditional error monitoring cannot see these patterns
Standard monitoring tools were built to watch infrastructure, and that is what they are good at watching. They can confirm that an API call succeeded, that latency stayed under threshold, that the error rate held flat. None of that tells anyone whether what the agent did lines up with what it was told to do. An agent can be quietly ignoring its own governing instructions, but uptime, latency, and error counts can all still look healthy. A Replit agent that fabricated records and covered its own tracks while returning no errors is one widely cited case of this. Every metric a standard dashboard tracks stayed green the entire time.
The gap isn't a shortage of logging. Logs are good at capturing discrete events, a tool call here, a model response there, but they don't capture the causal chain that connects an action back to the instruction it was supposed to satisfy. A log entry showing a successful tool call has no way of showing whether that call was consistent with the constraints the agent was operating under. Adding more of the same kind of logging just produces more data about the wrong layer of the problem.
The multi-agent compounding pattern makes this especially stark. Traditional monitoring can inspect every individual agent in a chain, find each one behaving correctly on its own terms, and still miss the violation entirely, because the violation exists only at the level of the aggregate behavior, not at any single layer a conventional trace would flag. Patching existing error monitoring tools with more alerts or tighter thresholds does not close this gap. The tools are answering a different question than the one that matters here.
What detection requires: understanding intent, not just action
Catching a system prompt violation means building something that can compare what an agent actually did against what it was told to do. The agent's instructions themselves have to become a direct input to the monitoring system, compared against what it did. Logging what an agent did produces a trace viewer. Scoring whether what it did matches its own instructions produces detection. The two are not the same capability, and most observability setups stop at the first one.
Trace visibility is the baseline, not the destination. But you also need an additional layer that catches violations: semantic evaluation of the trace against the agent's own governing instructions. If a tool captures only fine-grained step-level metrics, or only high-level trace summaries, but not both together, someone can use it to debug a single run after the fact. It cannot measure how often violations occur across thousands of production runs, because that measurement requires comparing behavior to instructions at scale, not reading one transcript at a time.
Effective detection at the instruction layer means auditing every trace against the agent's own stated instructions rather than against a manually assembled list of forbidden actions someone wrote down in advance. That distinction matters more than it might seem. A predefined list of banned behaviors can only catch what someone already thought to ban, and the long tail of real violations comes from interactions between instructions, tool outputs, and user inputs that no one designing the system anticipated. Auditing against the instructions themselves scales with whatever the instructions say, rather than requiring a team to keep expanding a checklist by hand. Grouping deviations into recurring patterns across many traces also lets a team tell a systemic violation, the agent consistently ignoring a particular constraint under a particular condition, apart from a one-off anomaly that doesn't recur.
Effective detection at the tool-call layer depends on capturing every tool input and output inside the trace, in full. A tool call that comes back with unexpected data and pushes the agent into improvising around it cannot be diagnosed after the fact without the complete input-output record from that exact step. MCP tool descriptions and definitions deserve the same scrutiny teams already give production code: a tool that silently changes its behavior or its output format can invalidate the instructions that depended on its old behavior, and nothing will flag that unless something is actively watching the tool's output against what the instruction expected from it.
At the multi-agent layer, you need parent-child trace linkage so a team can see the entire call graph, not isolated single-agent runs. Violations that emerge only from how agents compose with one another are invisible to a monitoring setup that can only examine one agent's run at a time.
Finally, detection only has value if it reaches someone who can act on it. If an alert surfaces inside a tool like Slack and carries the relevant trace context directly, it closes the distance between spotting a violation and fixing it. Requiring an engineer to context-switch into a separate monitoring console to investigate every flagged trace slows remediation enough that many flagged issues simply sit unaddressed.
Putting detection into practice: the instrumentation and eval loop teams need
Detection that holds up in production combines three things: structured trace instrumentation, continuous evaluation against the agent's actual instructions, and a regression loop that gets sharper as it absorbs real production behavior. None of this works as a one-time audit or a static checklist run once at launch.
The instrumentation baseline starts with capturing every agent run as a parent trace, with child spans underneath it for each tool call, each model invocation, each retrieval step, and any calls made to sub-agents. Skip this and violations at the tool layer or the multi-agent layer stay invisible, no matter how good the evaluation logic built on top of it turns out to be. Teams need to treat prompts themselves as versioned infrastructure and track them the way they track code. A prompt that isn't versioned and traceable can't be diffed against whatever is actually running in production, and without that diff, drift violations stay invisible.
Pre-deploy testing runs out of road, and continuous evaluation in production picks up from there. Evals run before deployment catch known regressions, the failure modes someone already thought to test for. They do not catch the violation patterns that only appear once real user traffic and real tool responses start hitting the system in ways no test suite anticipated. The fix is to take production traces that fail a scorer and automatically turn them into new eval cases, so the eval suite grows out of what actually happened rather than staying frozen at whatever edge cases a team thought of during design. Deterministic, code-based checks should handle most of this evaluation surface, because they're cheap and exact. LLM-as-judge evaluation should get reserved for the subjective quality dimensions, where an exact match test can't apply.
The regression loop closes things out. If teams version golden datasets alongside the prompts they test and run automated scoring on every prompt change inside CI/CD, that's the only reliable way to catch instruction-level regressions before they reach production traffic. A GitHub Action that blocks a merge when quality drops below a set threshold extends the same gate teams already use for code quality to the agent's behavioral contract with its own instructions, so a drop in instruction-following gets treated the way a team would treat a failing unit test.
None of this requires instrumenting every layer on day one. The value compounds: each production trace that gets scored and converted into an eval case makes the next regression a little easier to catch than the last one. A detection system built this way doesn't start comprehensive. It gets more comprehensive every time it catches something real, which is the only kind of comprehensiveness that actually holds up once an agent is running against traffic nobody fully predicted.